Tables vs. Charts
• Musings •
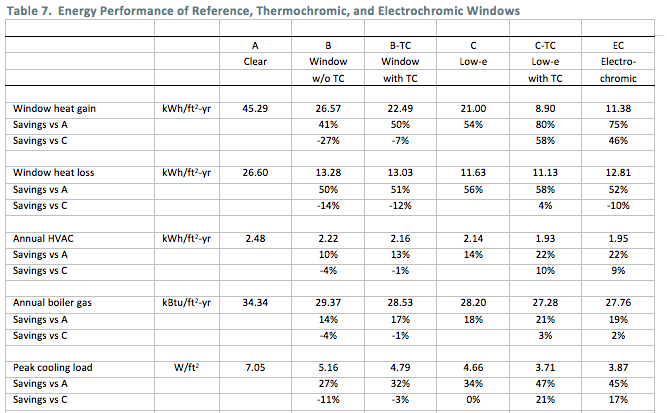
Use a table when you need to show individual values precisely. A graph works best when you want to show relationships. In our work with federal government research labs we translate scientific research on innovative technologies into publications for the rest of us. Below is a sample lab table translated into a graph.


